Visualize Your Data Story with Sunburst Chart
What is a Sunburst Chart?
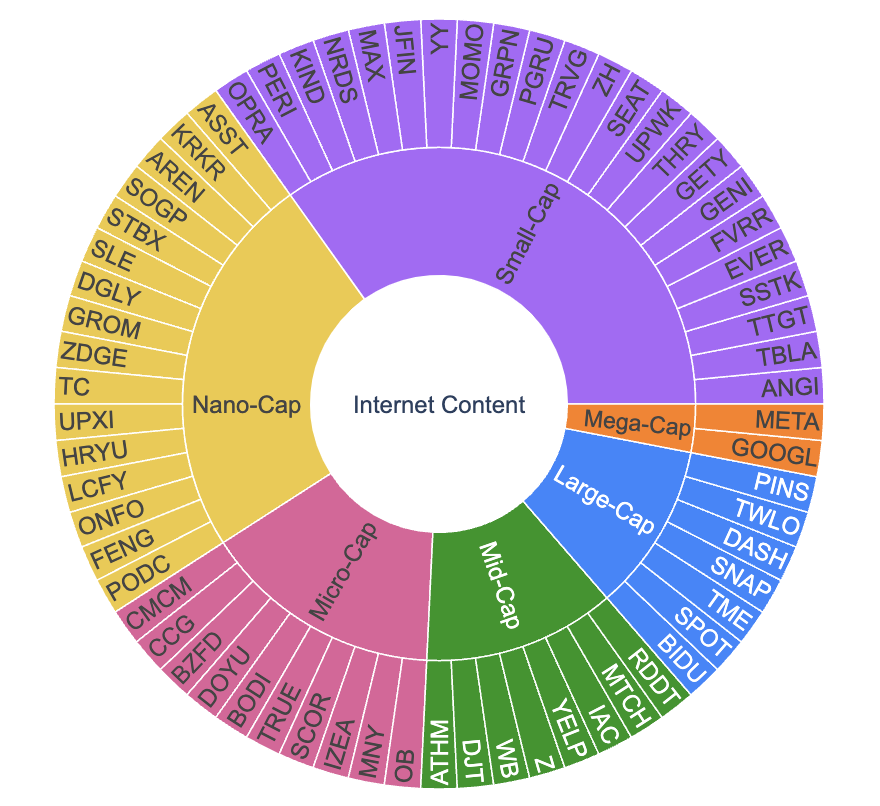
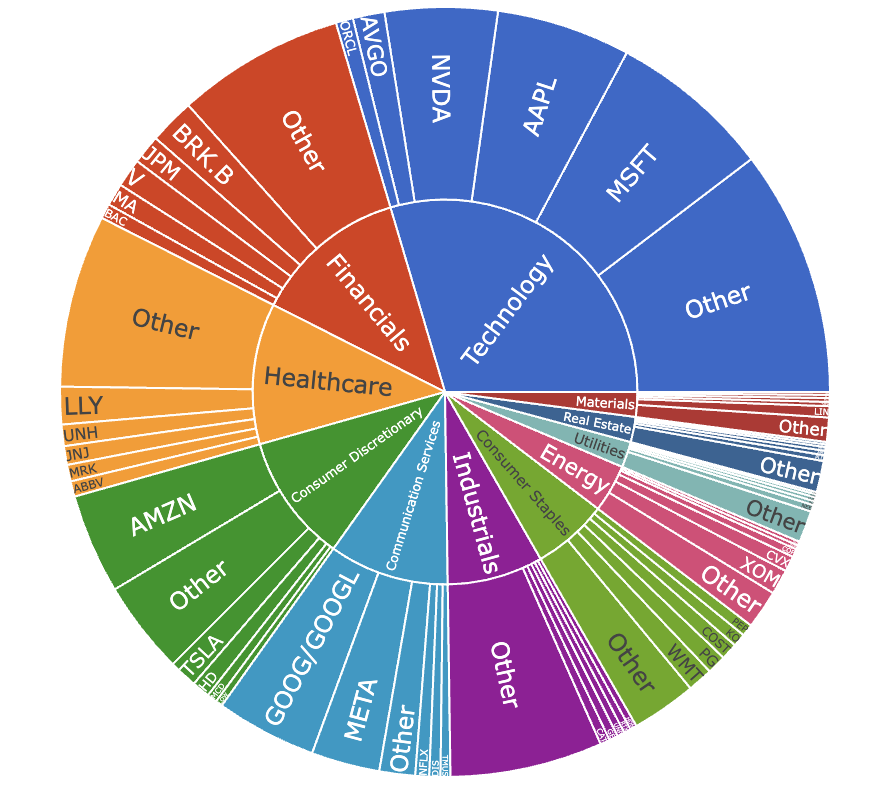
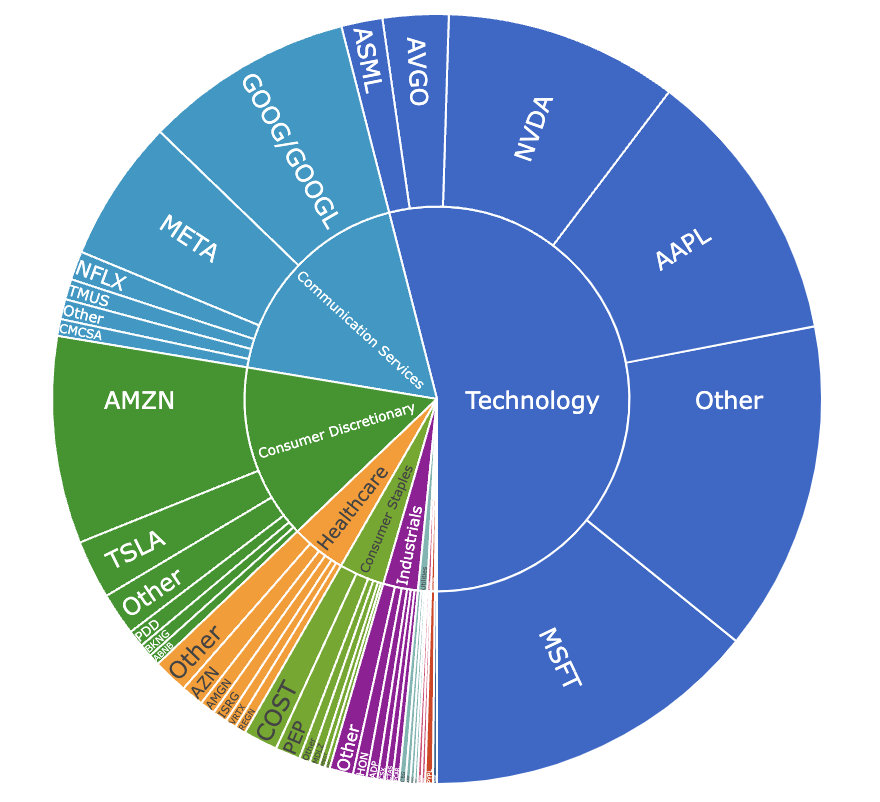
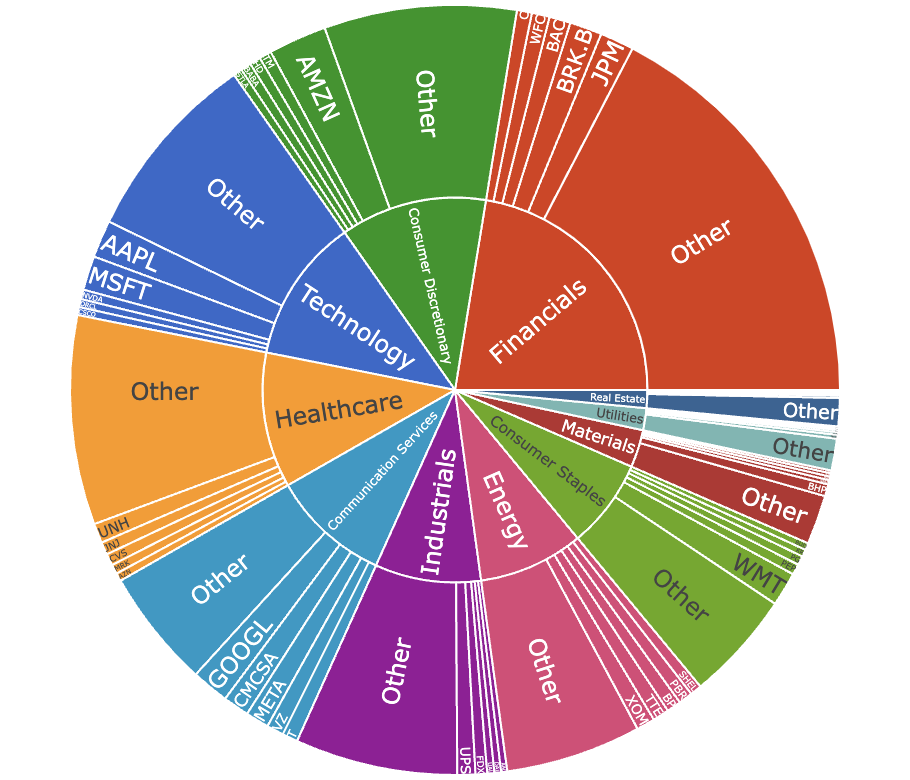
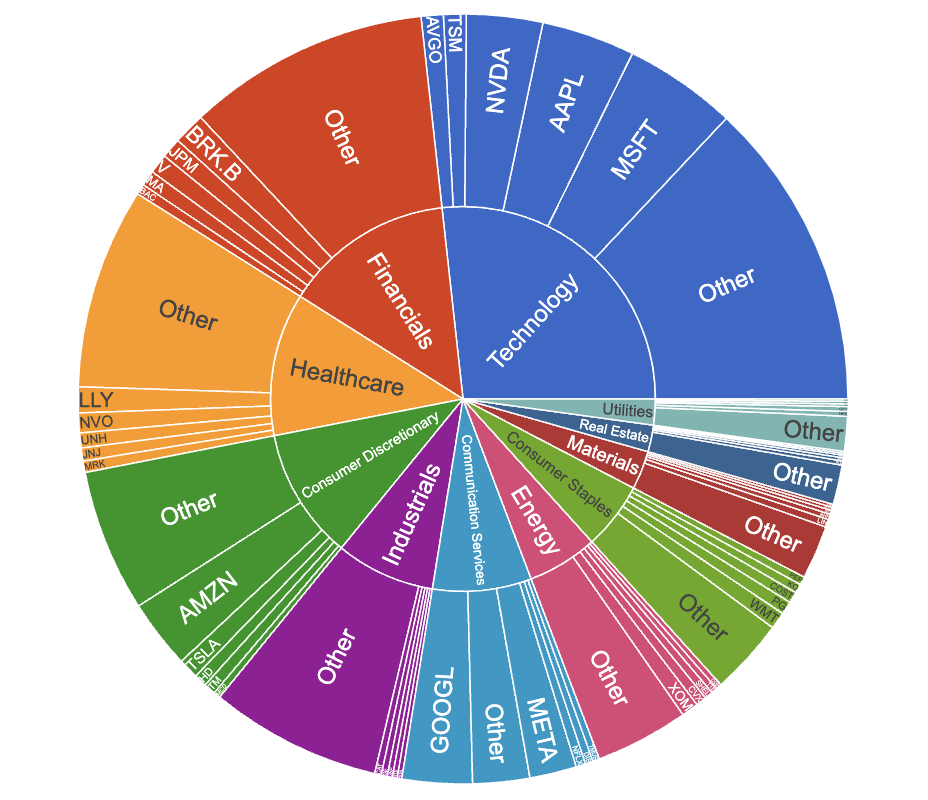
The traditional sunburst chart is an effective data visualization that displays hierarchical data in an engaging and visually appealing way. The centermost circle of the sunburst chart represents the highest level of the hierarchy, and each subsequent circle represents the next highest level. The size of each section within a single layer represents its proportion to the whole level. You can also use colors to differentiate between categories and enhance your visualization. Sunburst charts are powerful tools for understanding complex relationships and they offer a clear and intuitive way explore hierarchical data.
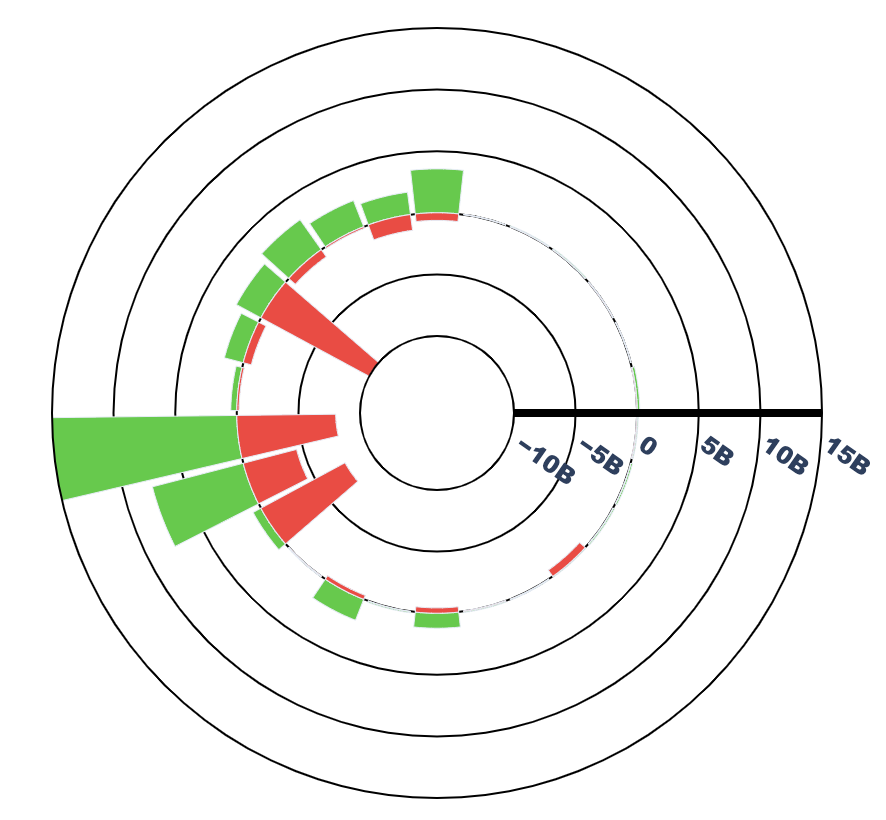
There are other circular data visualizations that can be great tools for displaying nonhierarchical data in captivating ways. These include:
